 |||
|||
Energy savings calculator coming soon.
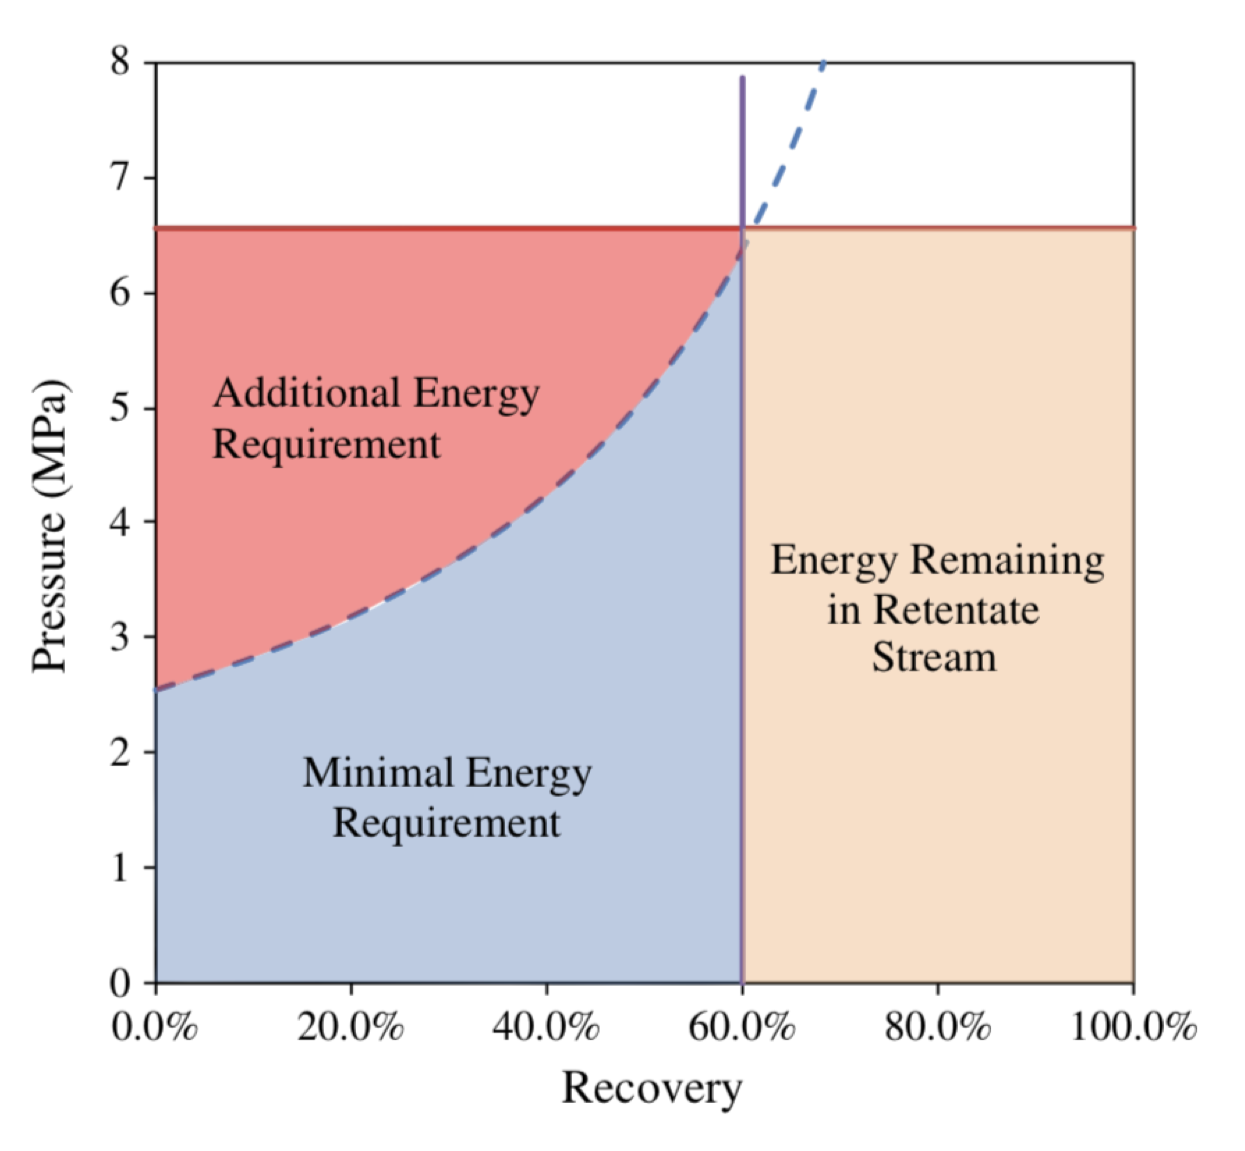
The energy consumption of RO processes can be broken into three main components as shown on Pressure vs. Water Recovery diagram.
 Liu et al., “Energy analysis and efficiency assessment of reverse osmosis desalination process” Desalination (2011)
In this type of figure, area corresponds to energy consumption1. What’s shown here is a seawater RO system operating at 60% recovery.
Desalination is an inherently energy-intensive process. The blue area under the “osmotic pressure curve” is the minimal energy required to produce freshwater from a salty feed. As water recovery increases, the feed gets saltier (i.e. brine) and higher pressures are required.
In regular RO processes, nearly half of the input energy leaves the system in the form of pressurized brine. At first, this energy (orange area beyond 60% recovery) was all wasted. Today, modern energy recovery devices (ERDs) like pressure exchangers and turbochargers recycle this energy quite efficiently.
The best strategy for reducing RO energy consumption it to avoid excess pressurization. This last chunk of energy lies above the osmotic pressure curve in red. This energy is inherent to the conventional RO configuration.
Conventional RO is a continuous, once-through process. Feed is pressurized by a pump before it enters the membranes, so the front of the system is over pressurized.
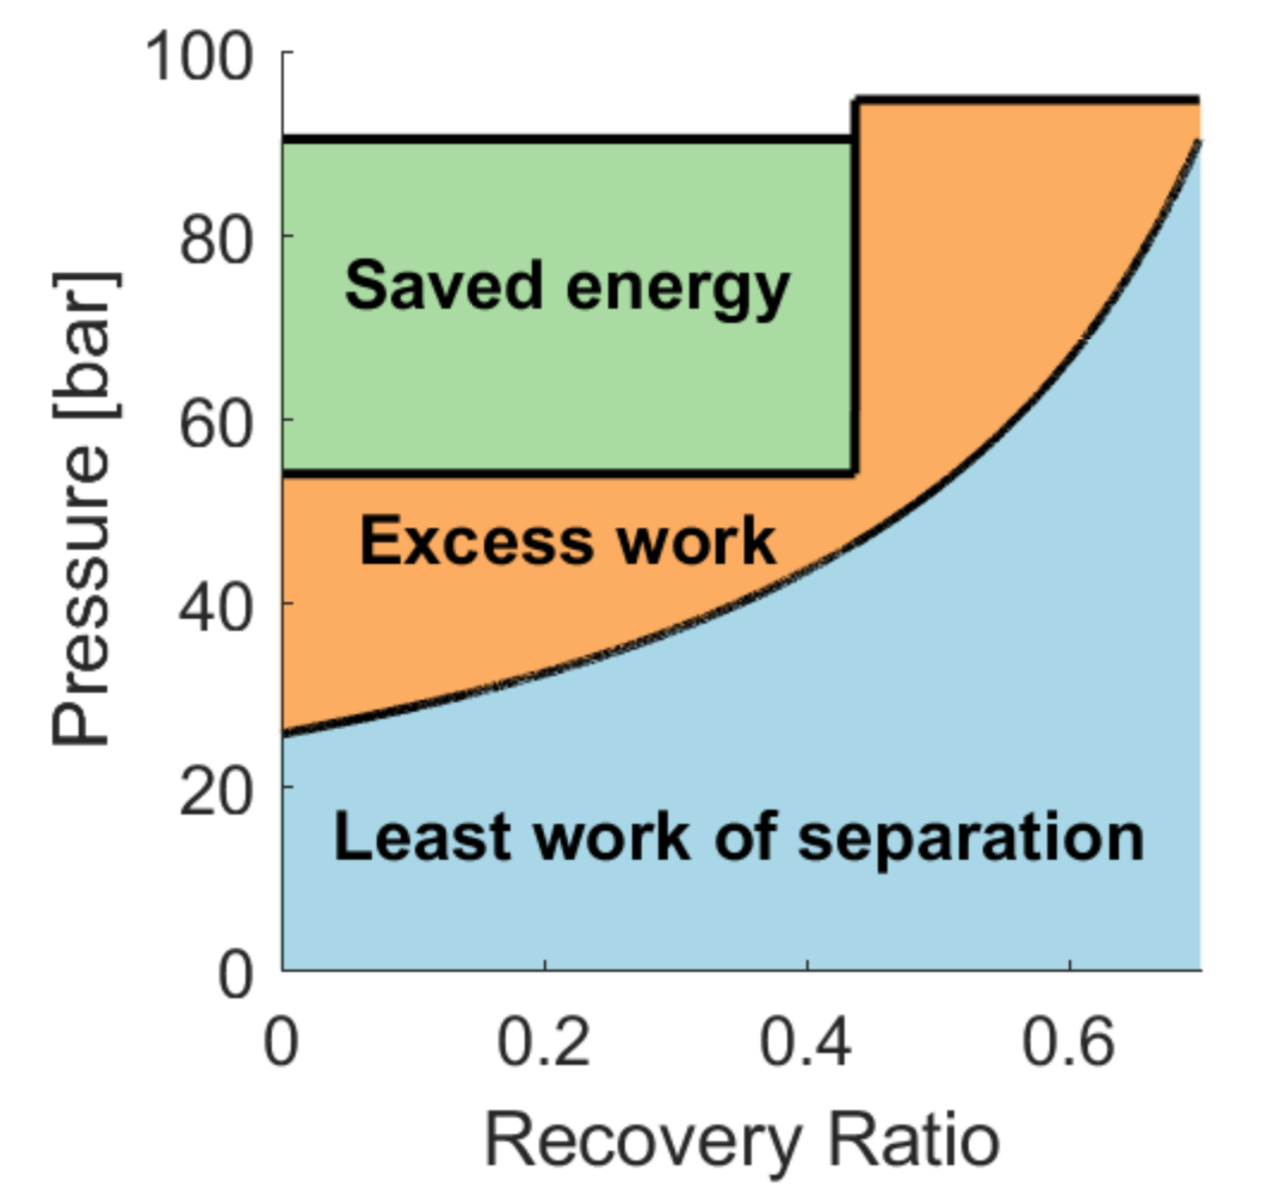
But what if we added another pump?
If we split the RO system into two, the first stage can start out at a lower pressure. We get freshwater out of the first stage before pressurizing for the second stage. In this way, we can take out a good chunk of energy.
 Wei et al., “Saving energy with an optimized two-stage reverse osmosis system.” Environmental Science: Water Research & Technology (2017)
You can imagine that if we added a third stage, we could save even more energy, but of course with diminishing returns. Each additional stage requires additional equipment (pumps, vessels, pressure exchangers, piping).
What if you could have infinite stages, but without all that additional equipment? That’s the power of batch reverse osmosis.
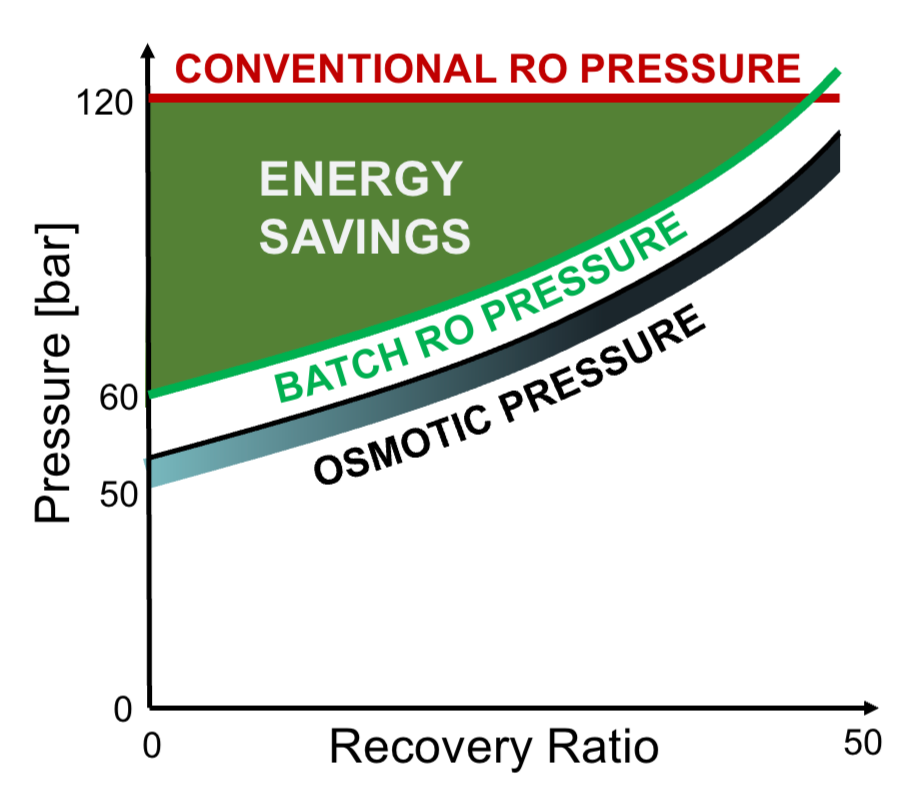 Batch RO achieves the lowest possible energy consumption by tracking the osmotic pressure curve.
Treating water in batches gives us a dynamic process rather than a static process. The stages exist in time rather than space, and our high pressure pump can apply just the right amount of pressure at all times to produce freshwater as efficiently as possible.
Remember, there’s no way to go below the osmotic pressure curve. So this is the best we can do.
because water recovery is proportional to volume. This isn’t the case for Pressure-Length diagrams↩︎